Cairo International Airport - Command Hub
A dashboard concept that organizes terminal activity, operational issues and alerts.
RoleUX & Data Visualization Designer
Designed dashboard hierarchy, warning states and interactions.
Problem
An operational display needs to show where an issue is, how urgent it is and whether the data is current. I explored that hierarchy in an airport dashboard concept.
Key decisions
I established terminal scope before showing detail, then placed active issues ahead of routine flight information. Warning and connection states sit beside the relevant data so the viewer can interpret them in context.
Solution
I designed the information hierarchy, warning states and interactions, then translated them into a responsive web demonstration. Demo data connects terminal navigation, operational summaries and flight details.
Explore screens & design details
A closer look at the features, interface and evidence behind the work.
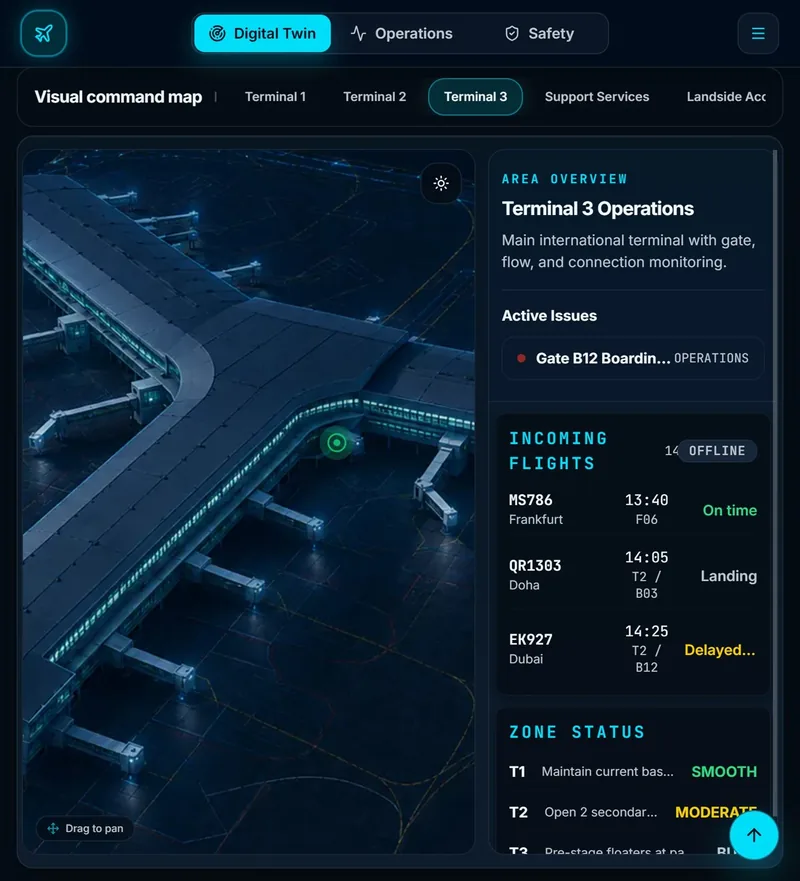
I placed configurable warnings beside the operational information they explain.
Trade-off: Combining signals increases density. Operational reviewers need to test whether priorities and full warning messages remain clear.
A closer look at the design
Explore three decisions in the interface. Open a numbered detail to highlight its place in the screen.
01 · Establish the operational scope
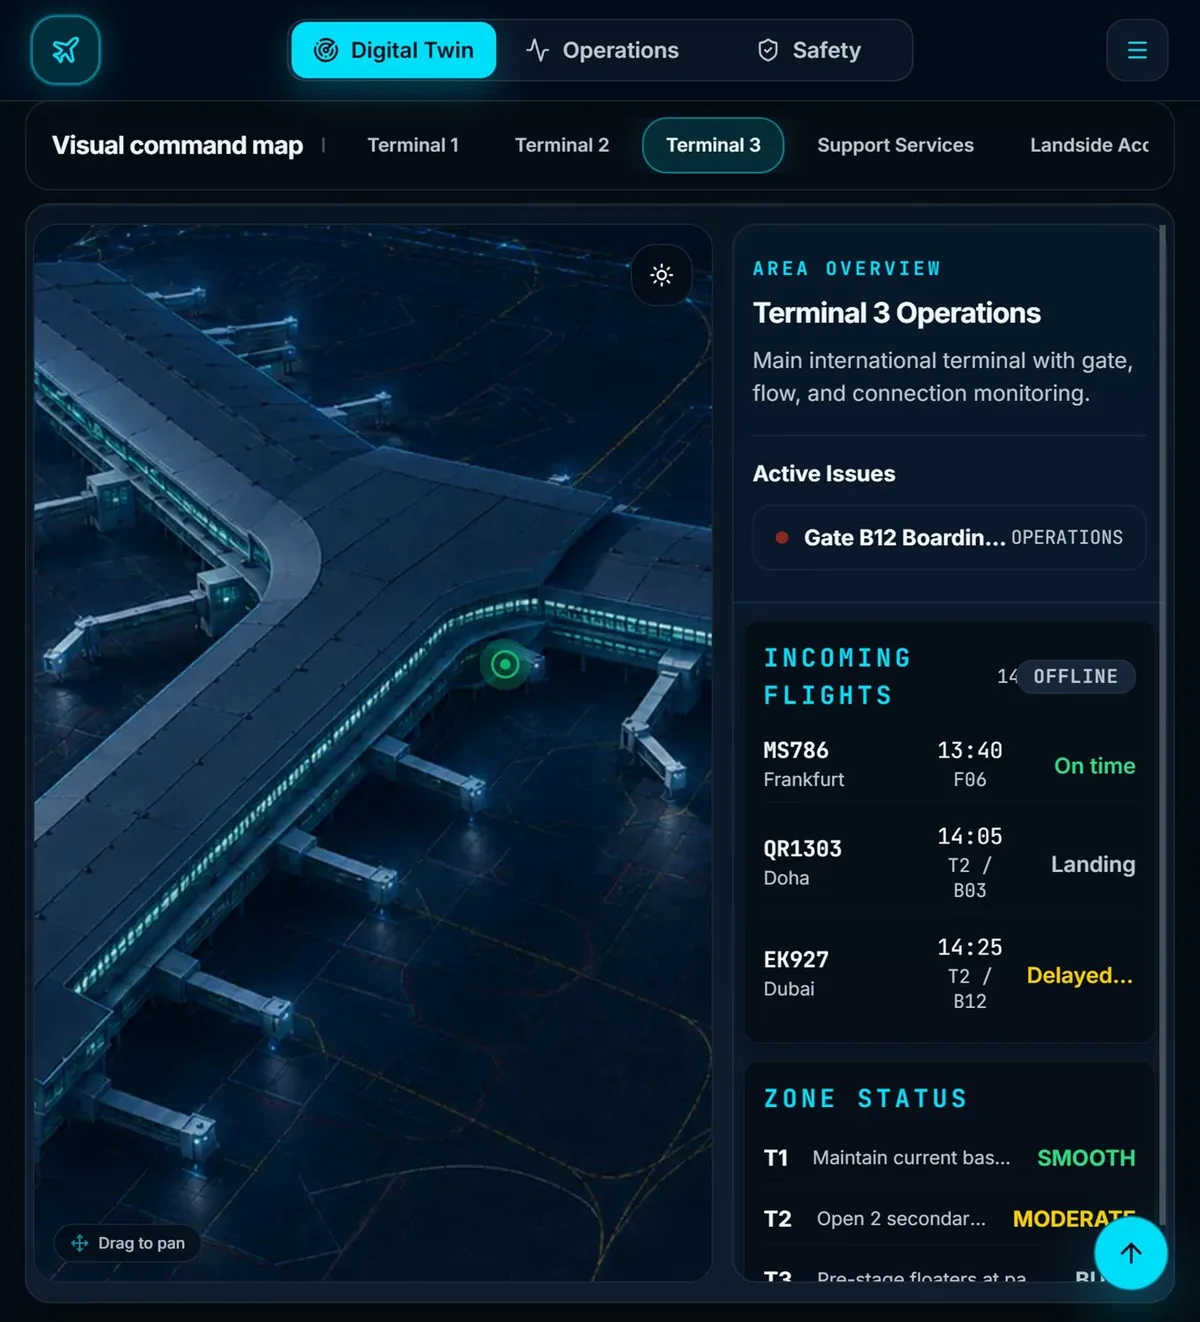
The terminal selector sits above the map and highlights Terminal 3. Establishing scope before presenting detail helps explain which part of the airport the overview refers to.
02 · Bring exceptions into view
The area overview places active issues before the flight list. This hierarchy gives exceptions a clear place beside the map. Long issue labels still need validation for readability and access to the full message.
03 · Make data freshness visible
The flight card shows an OFFLINE label alongside flight and status text. Showing the connection state helps people question data freshness. The public concept demonstrates this presentation; it does not establish a live airport feed.
Why this approach
Terminal scope gives each signal a location. Prioritizing exceptions and showing connection status helps a viewer decide which details to inspect and whether the information needs checking.
What I learned
Translating the Figma layout into a working dashboard exposed how information density changes across screen sizes.
Next validation task
Use a simulated delayed-flight scenario. Ask operational reviewers to locate the issue, explain the warning and choose an action. Compare interpretation and task time across screen sizes.
Evidence includes designs, live demos, and documented decisions. Business outcomes require sourced measurements.